 Ask A Bot
Profiling
Sentry's profiling feature builds upon our established Performance Monitoring capabilities to provide precise code-level visibility into application execution in a production environment. Profiling provides context at a deeper level than traditional
Sentry profiling supports common platforms for both Mobile and Backend applications:
- Mobile app profiling makes it possible to collect profiles from real devices in production, providing a complete picture of how the app performs in a variety of environments.
- Backend platform profiling makes it possible to easily target the essential code that yields the biggest improvements in backend throughput and resource utilization.
Zooming In From Performance to Profiling
Sentry profiling data is structured as an extension of performance transactions. This means you can "zoom in" on transactions to see their profiles directly by clicking on any transaction on the Performance page.
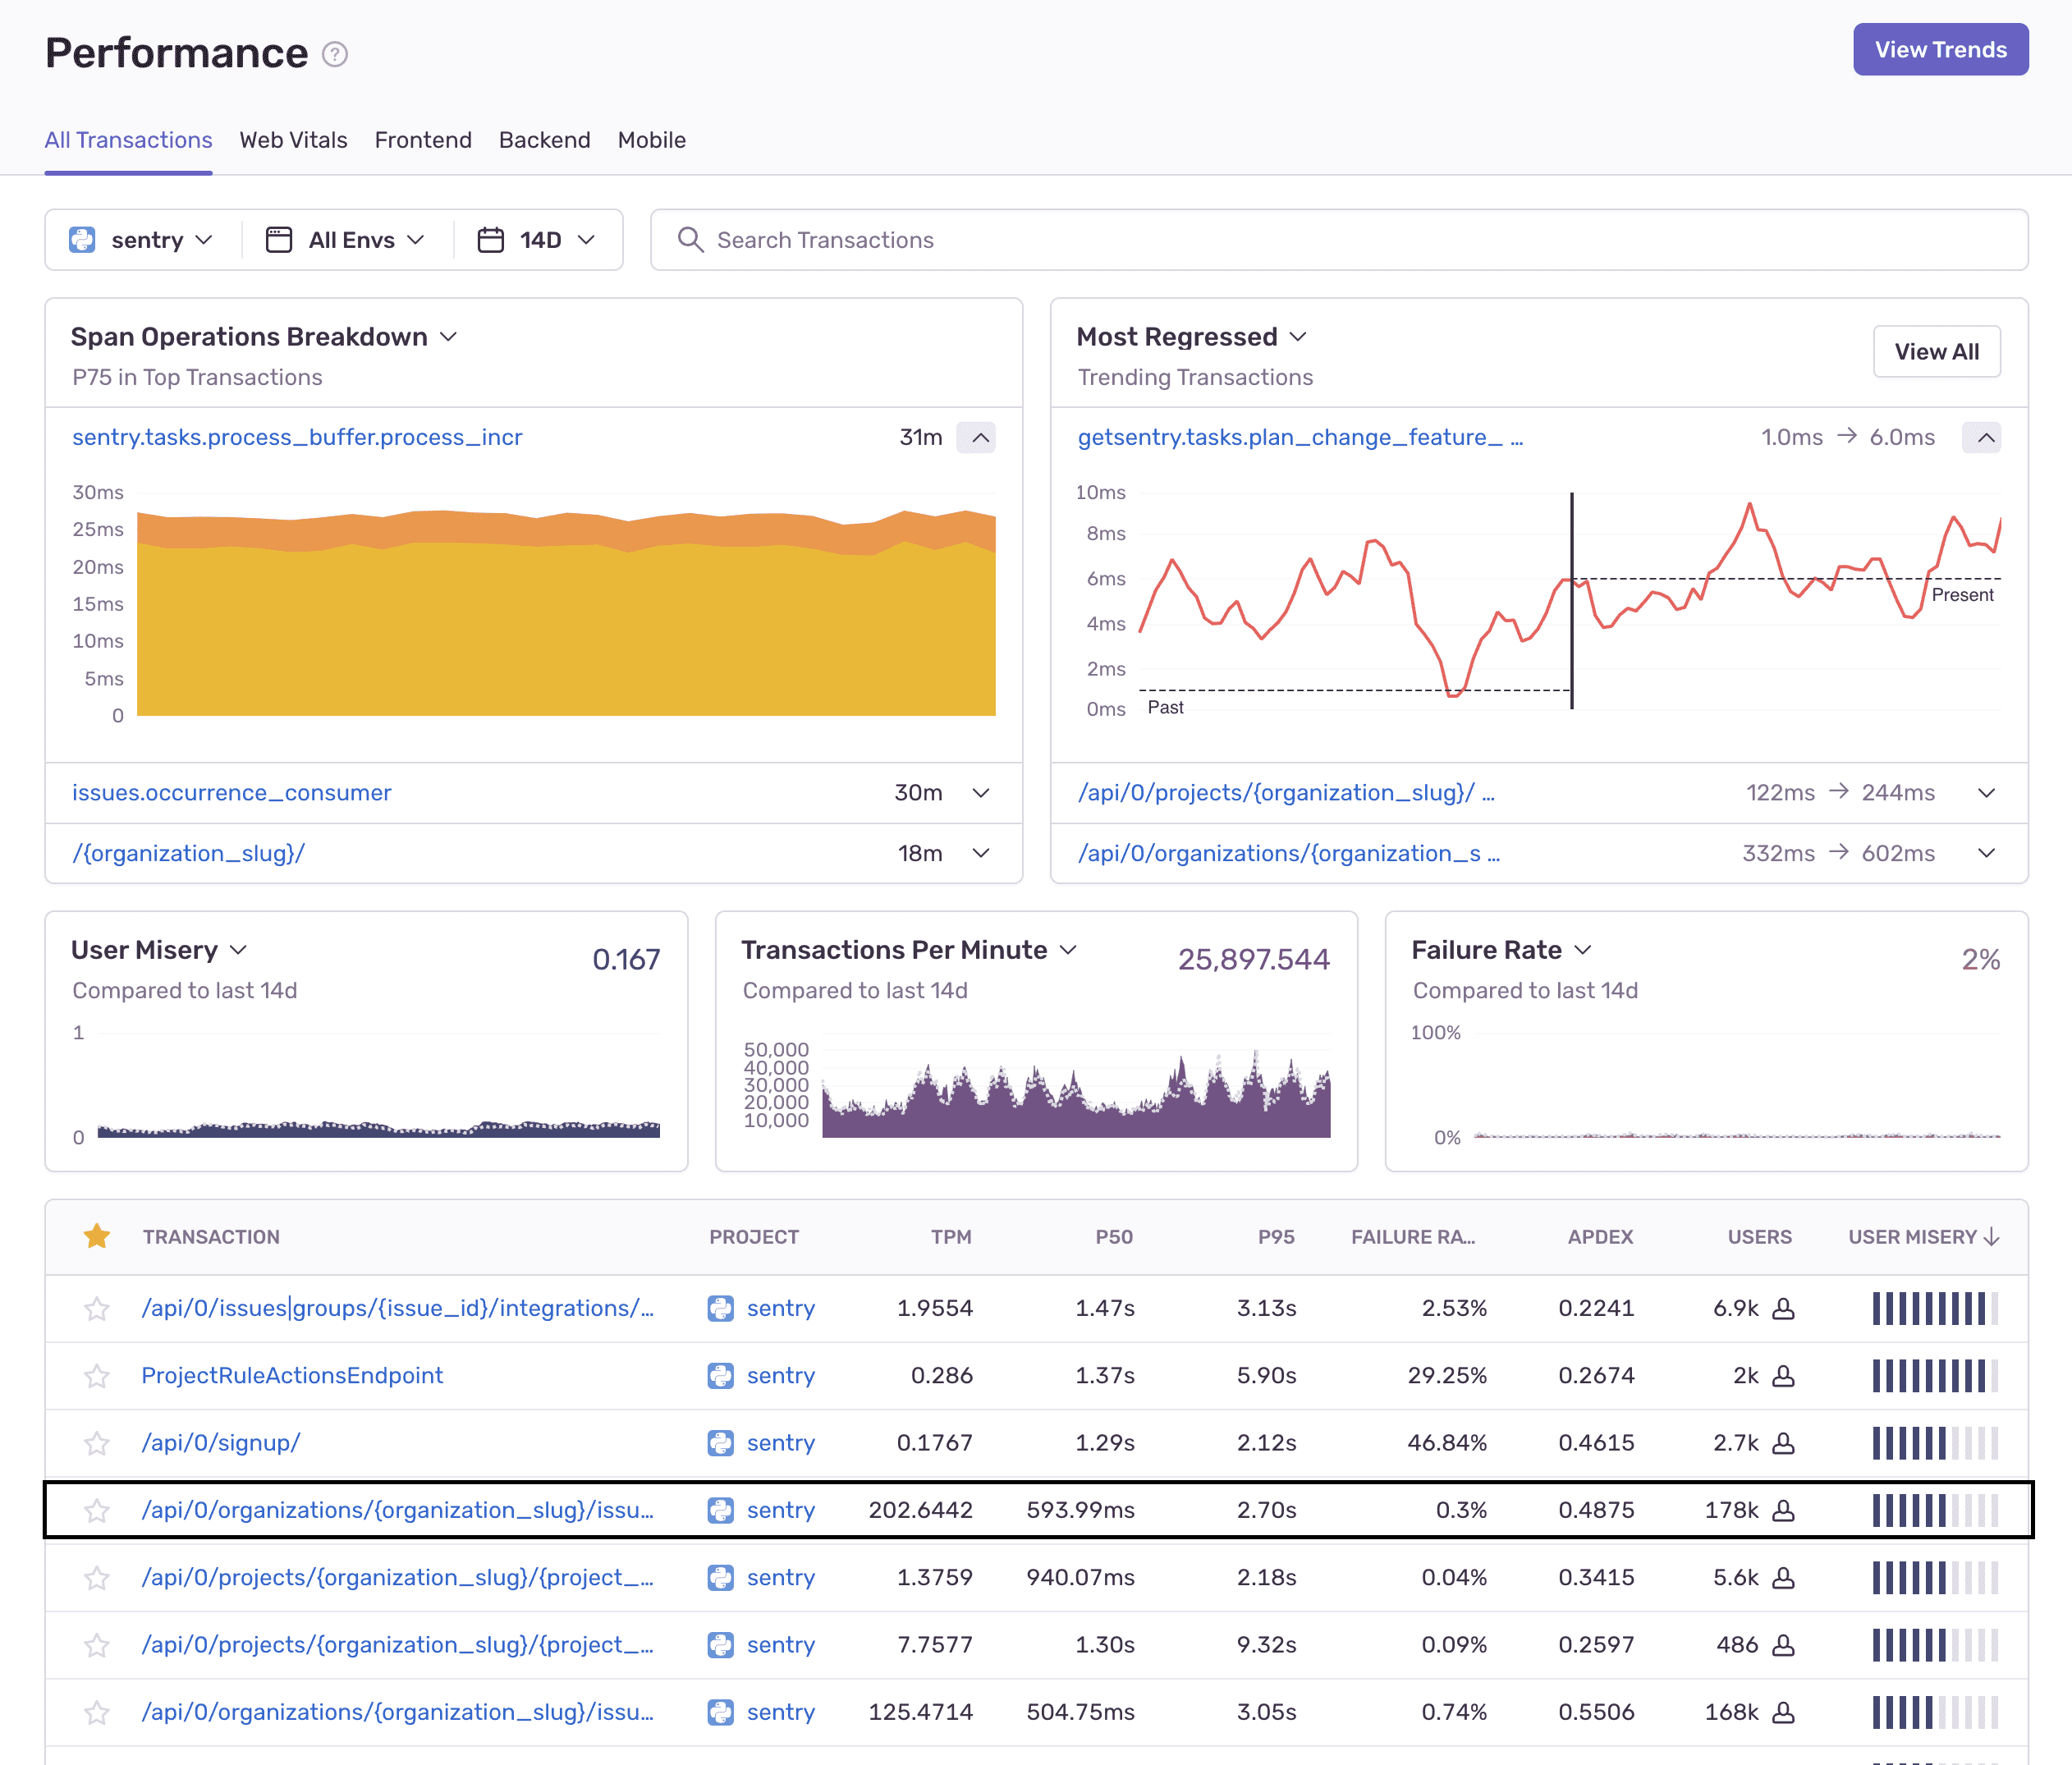
This will take you to the Transaction Summary page where you'll see a list of transaction events.
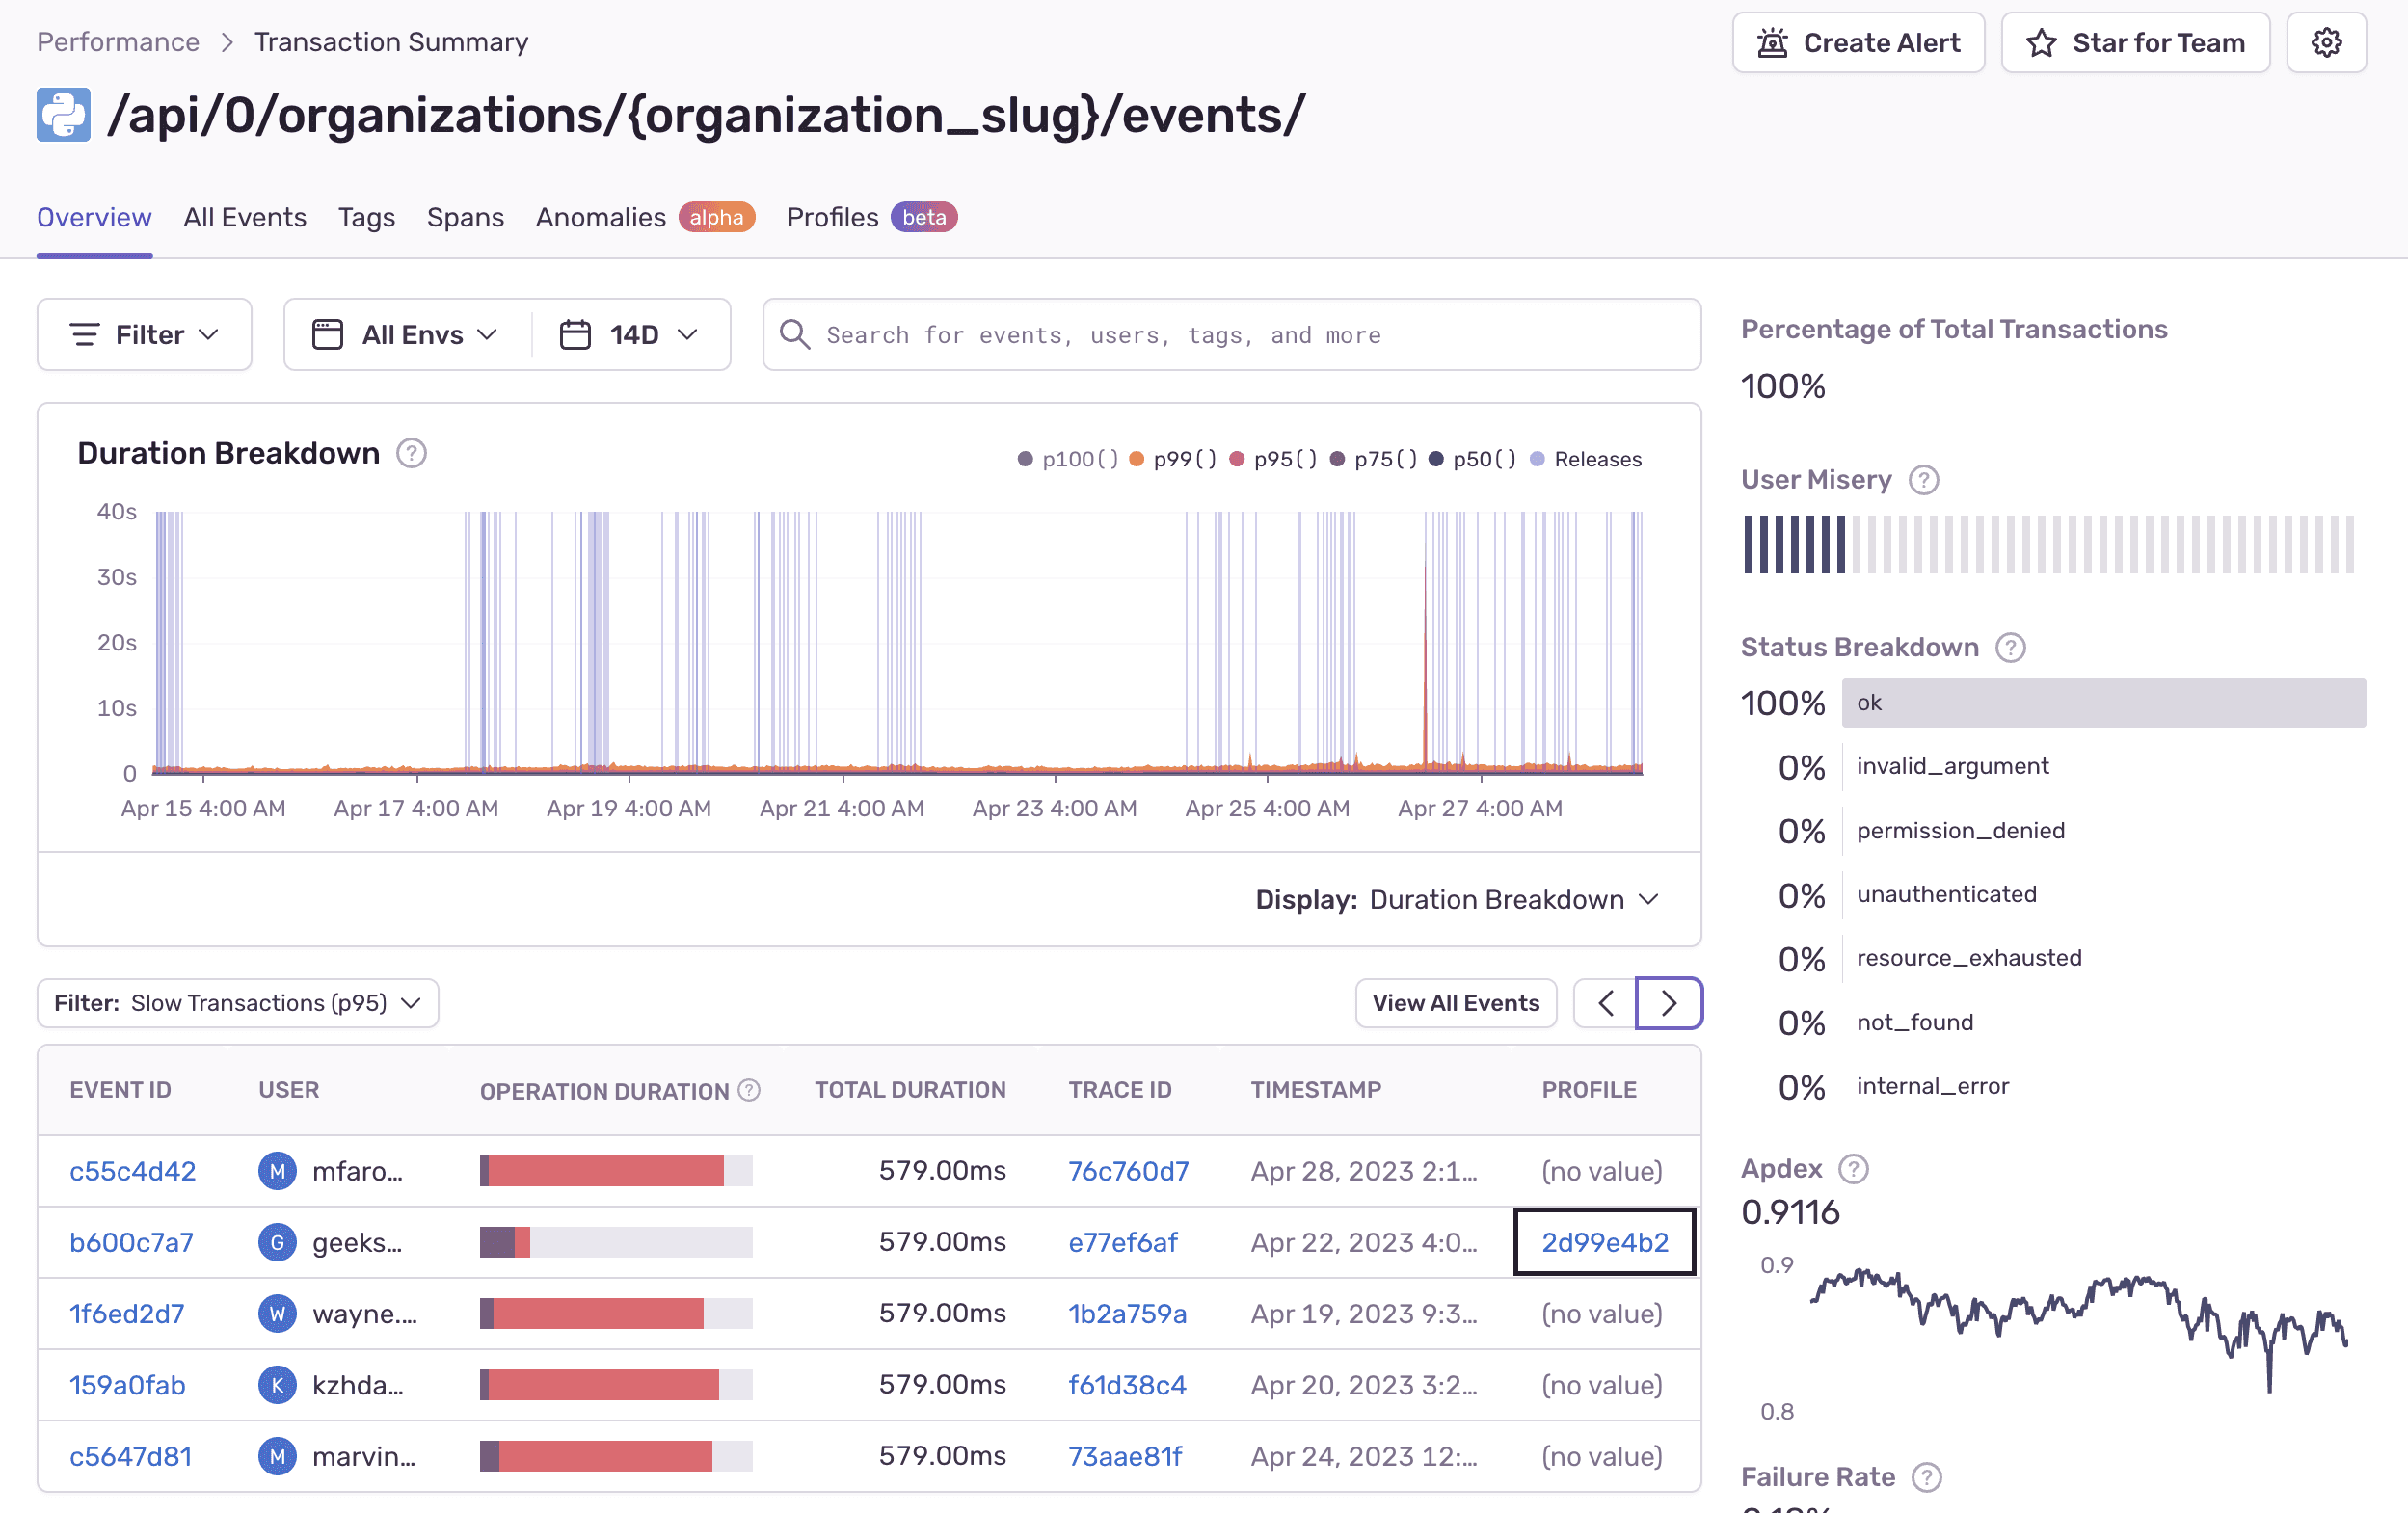
Transaction events that have a profile contain a link in the "Profile" column which will take you to a flame graph with details about that event. Learn how to read Flame Graphs and Aggregated Flame Graphs.
Alternatively, if you click on the "Event ID" for a transaction, you'll see a span waterfall where you can identify suspect spans - operations that may be impacting performance, including slow DB queries and HTTP requests. You can click on a span to see profile information, including the most frequently occurring code path (call stack with with exact line numbers), along with the approximate percentage of time required for that code path.
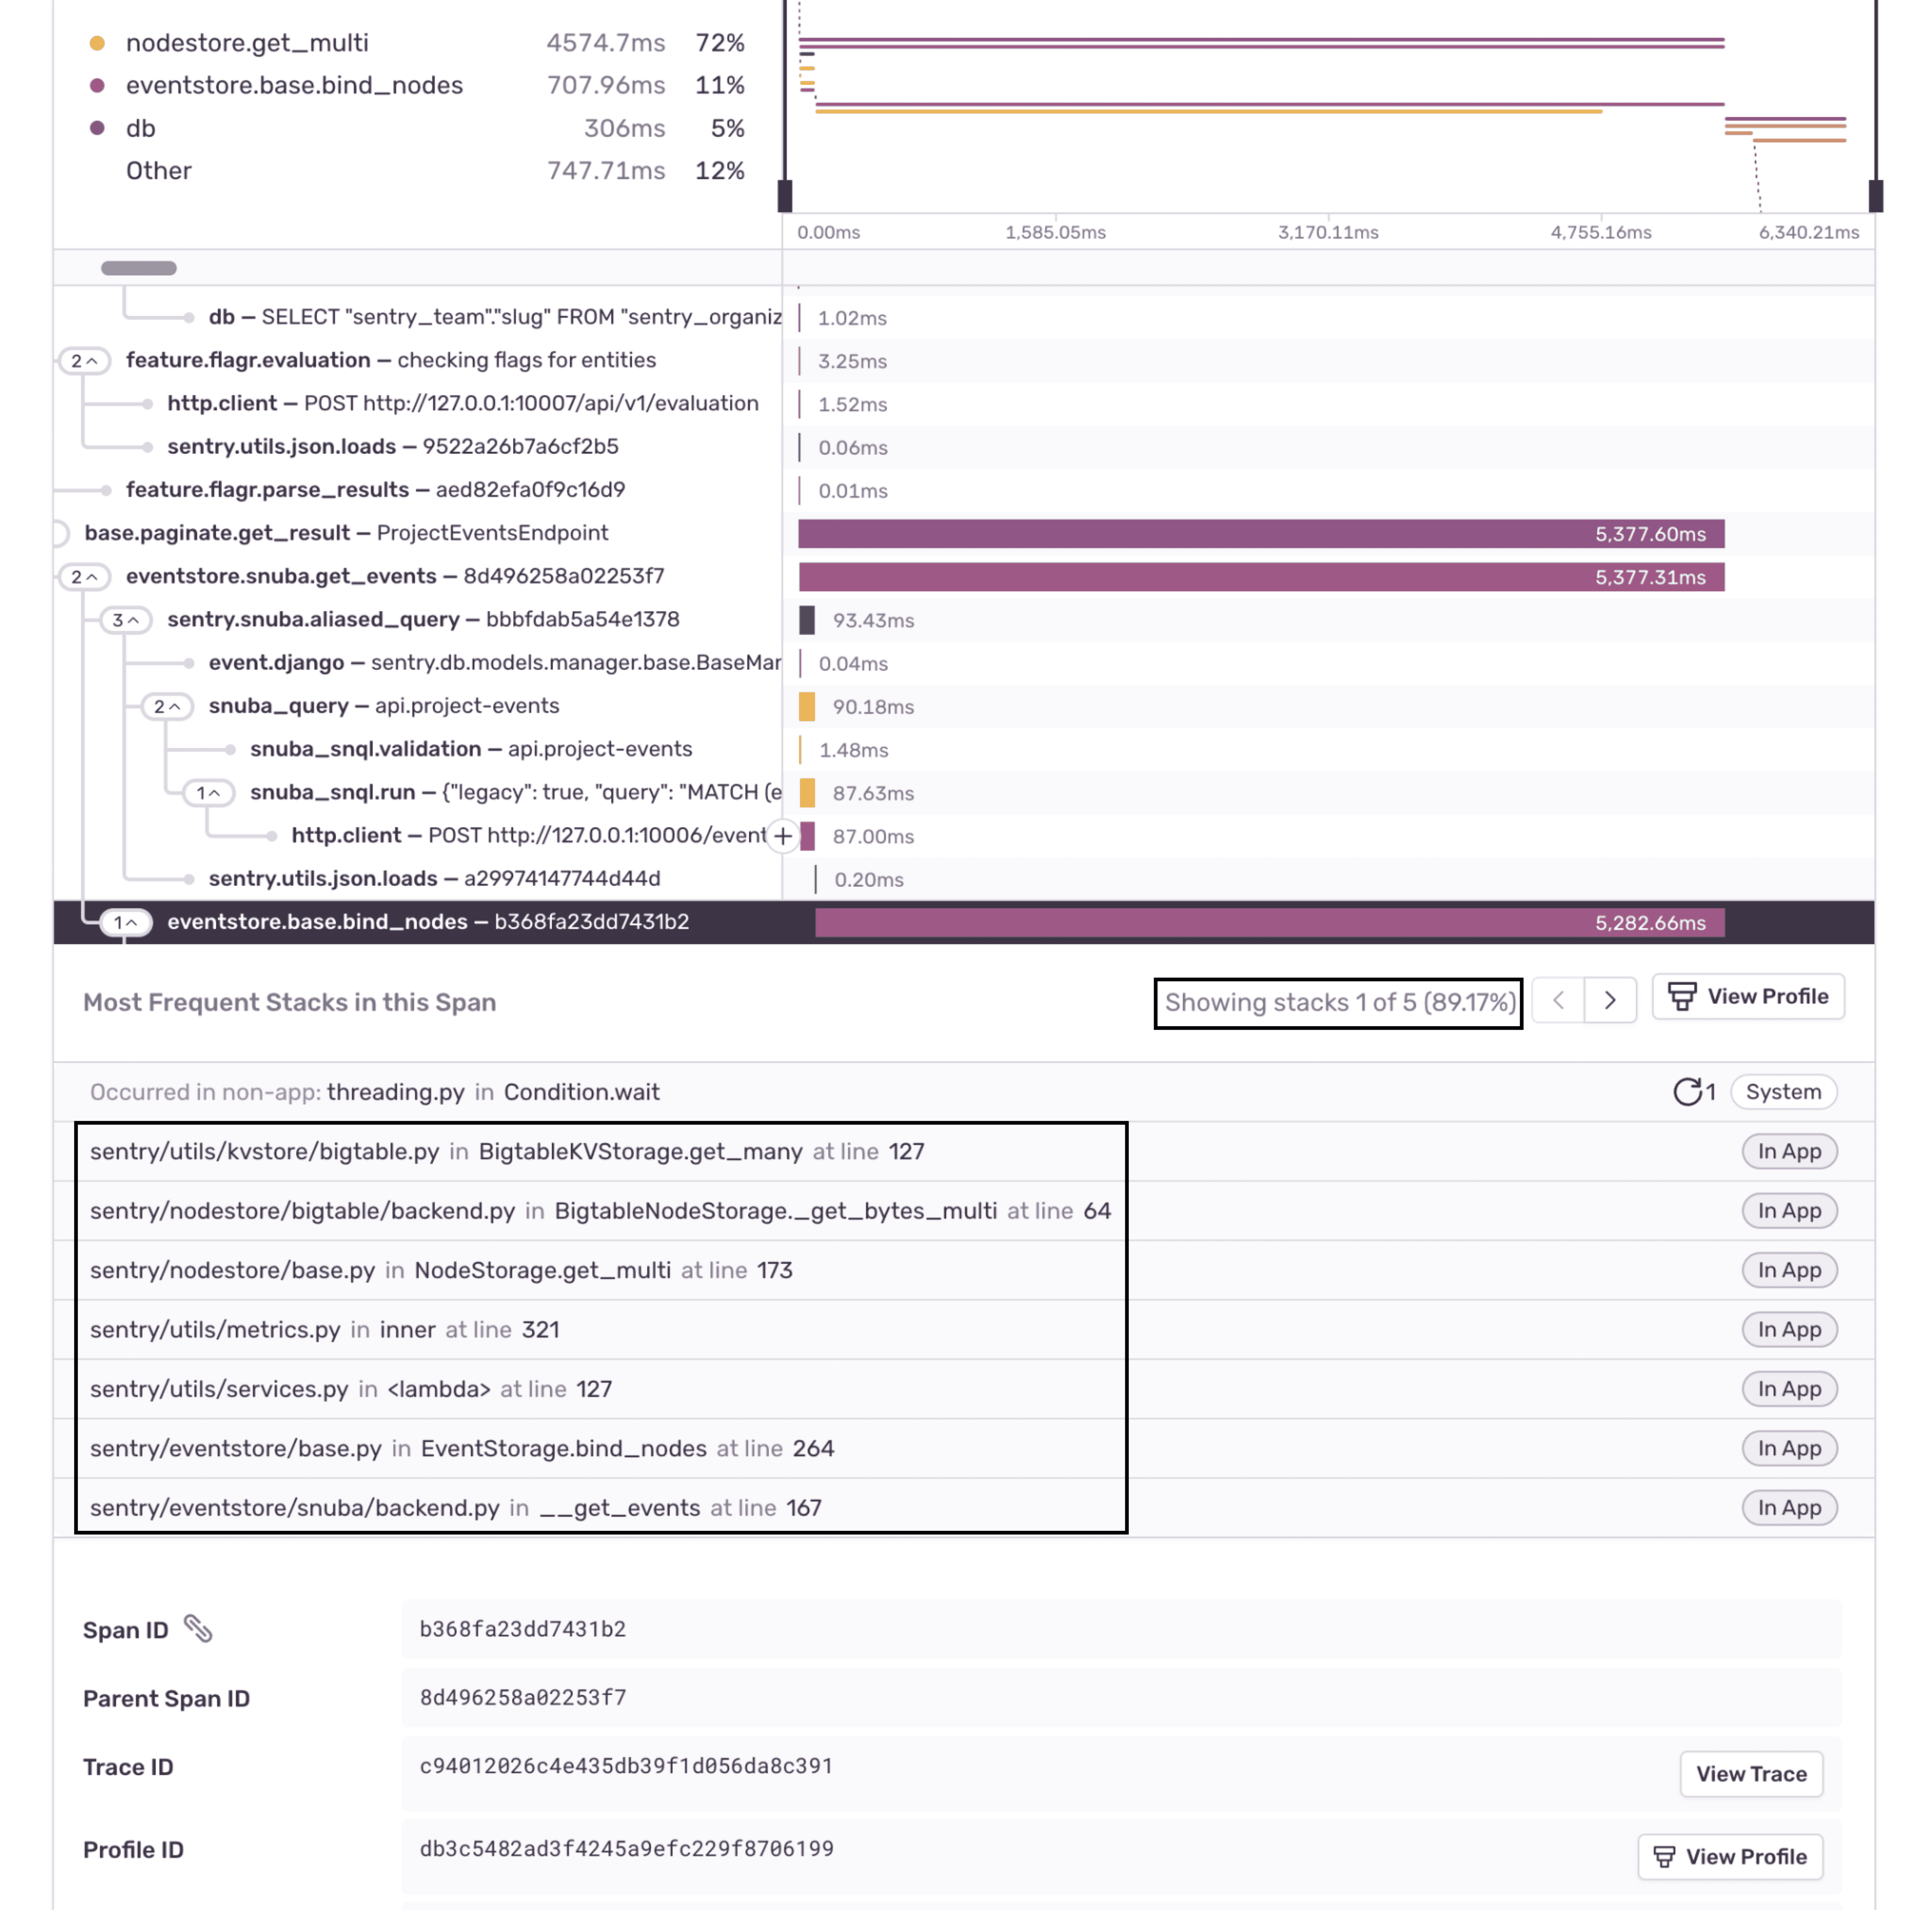
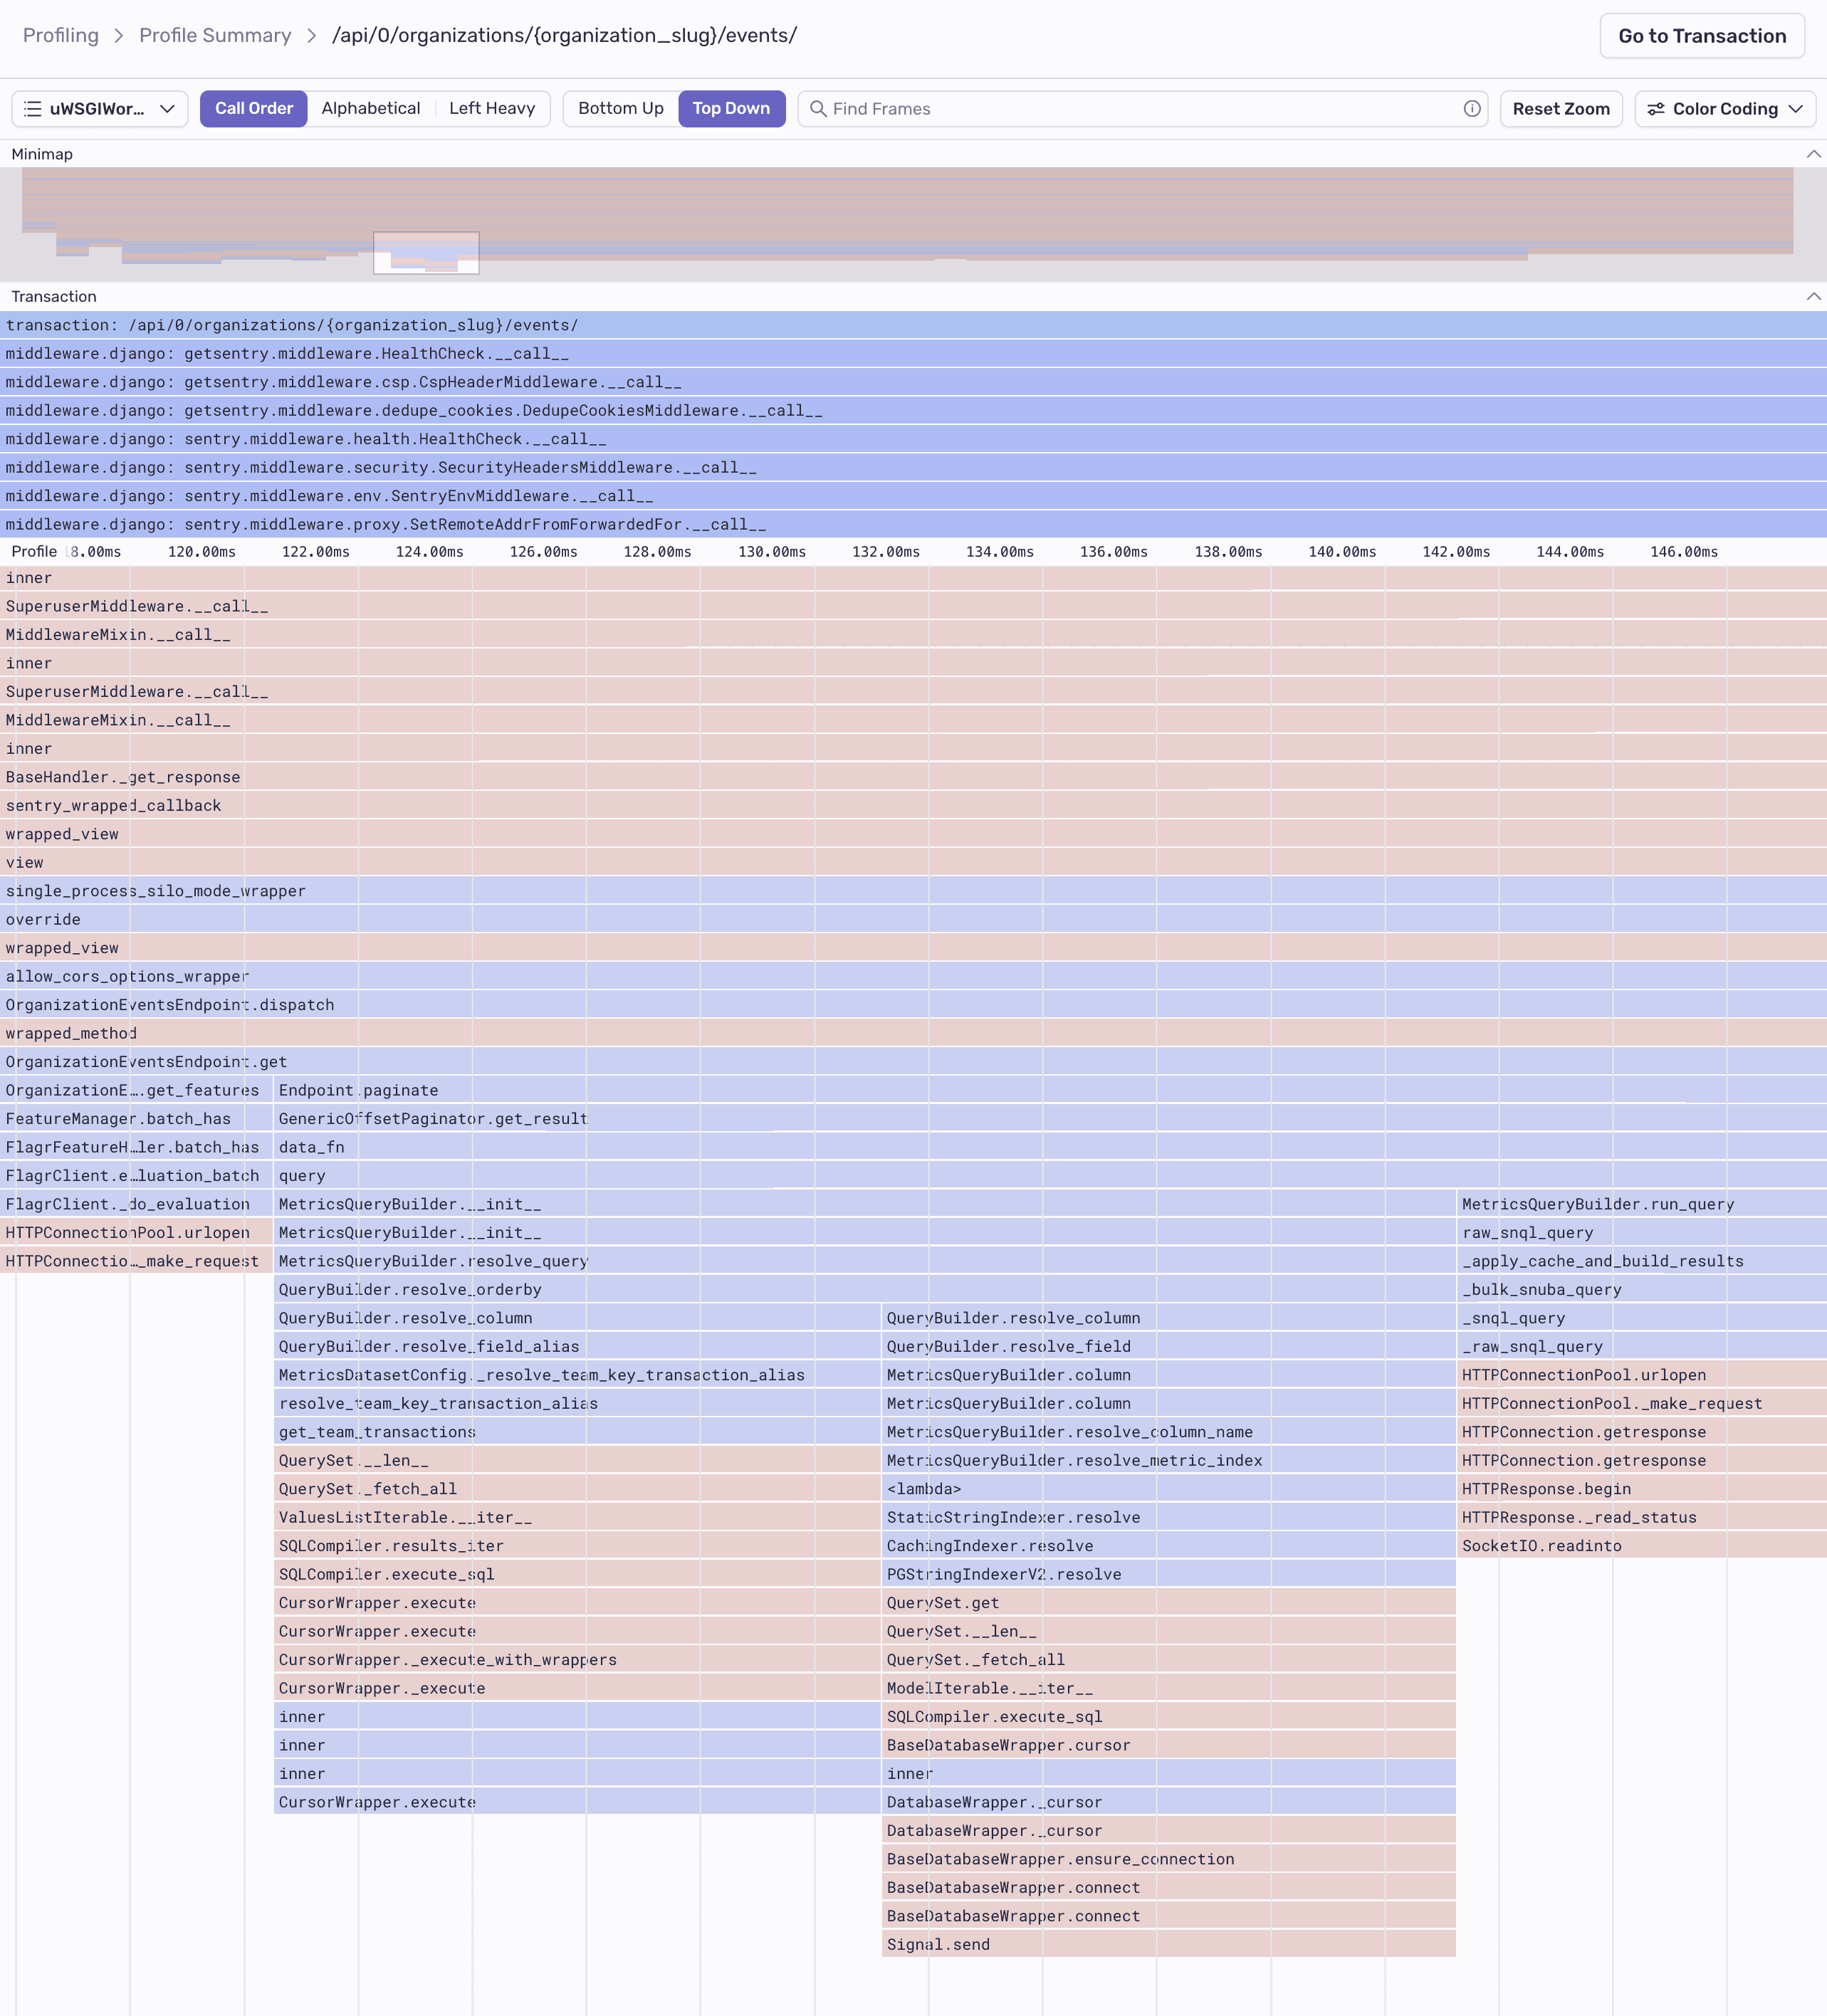
From this view, you can also click "View Profile" to zoom in on the flame graph.
Profiling Page
The Profiling page shows a list of transactions in descending order of execution time for your selected
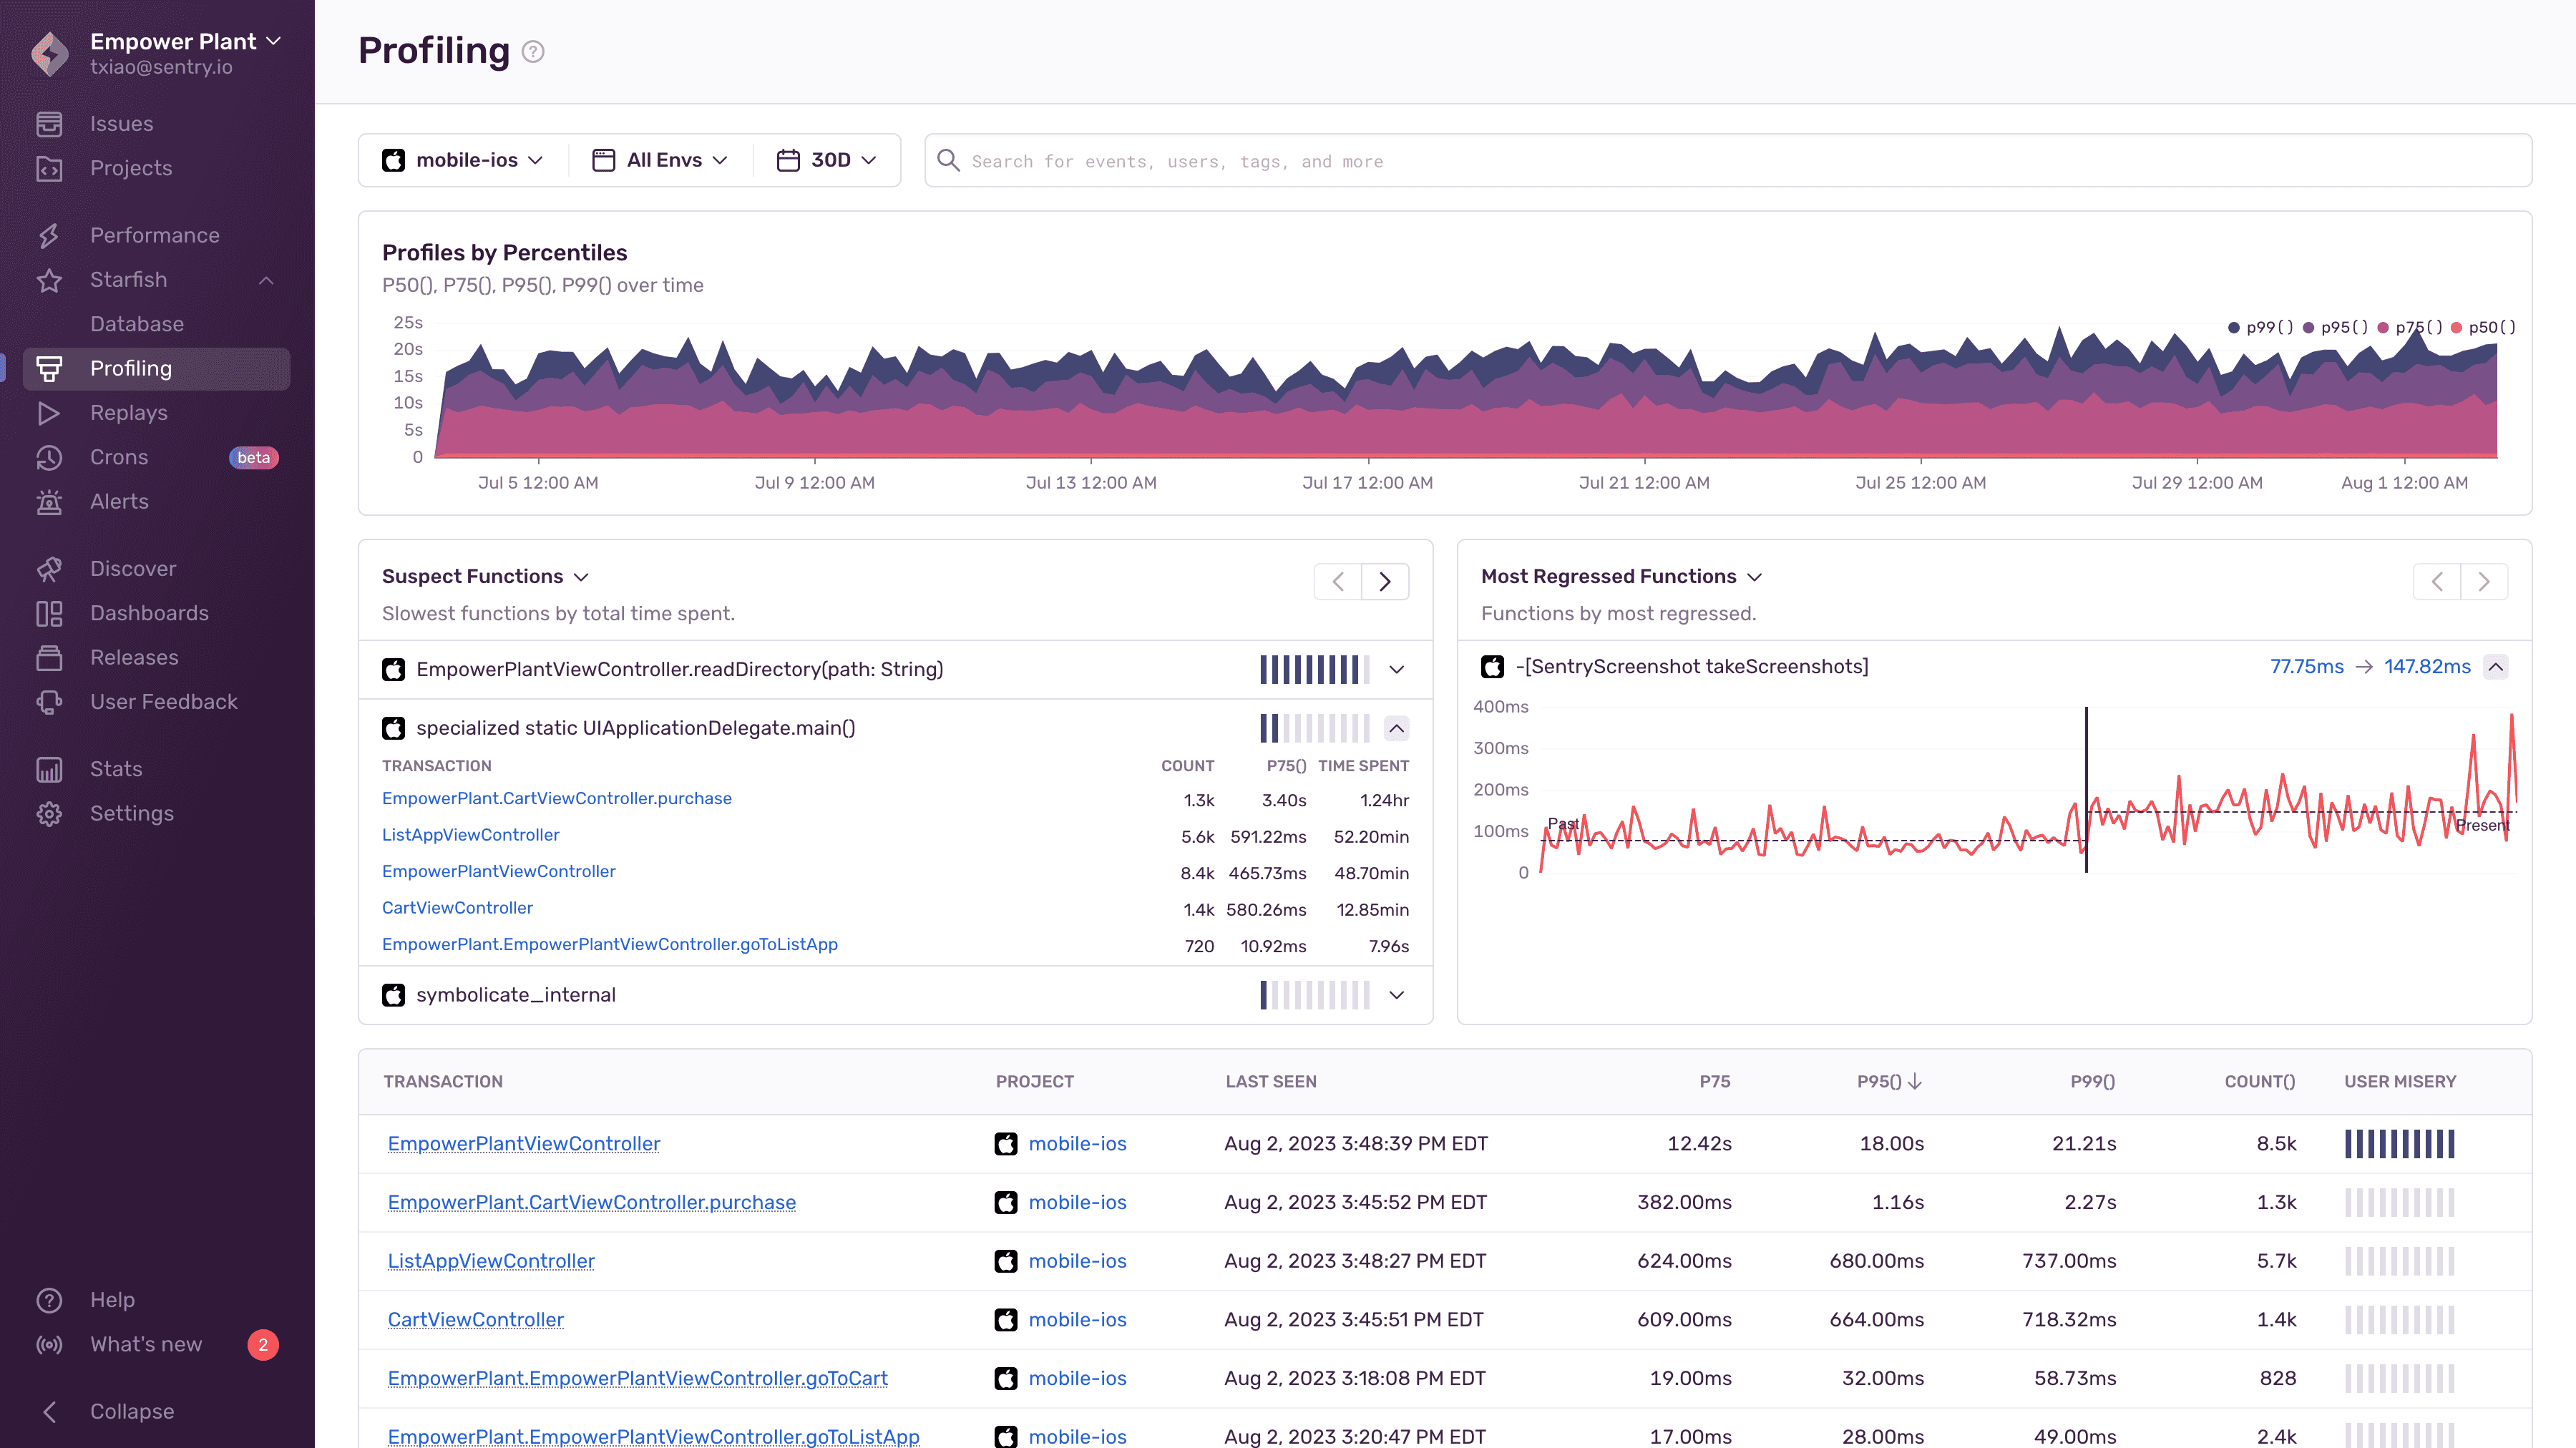
The "Profiles by Percentiles" timeline chart can be used to filter the transaction data by highlighting the desired time period. Below that, there are three widgets to choose from.
The "Slowest Functions" widget shows you a list of the functions that took the most time in your application. It lists the transactions the function was called from. Clicking on a transaction will take you to an example profile. The "Most Regressed Functions" and "Most Improved Functions" widgets show you a list of the functions that have gotten slower/faster over time. Clicking on the timings will take you to an example from either before/after the detected regression/improvement.
Using the Profiling page is typically an advanced workflow, enabling you to directly select transactions of interest and examine detailed profiling data.
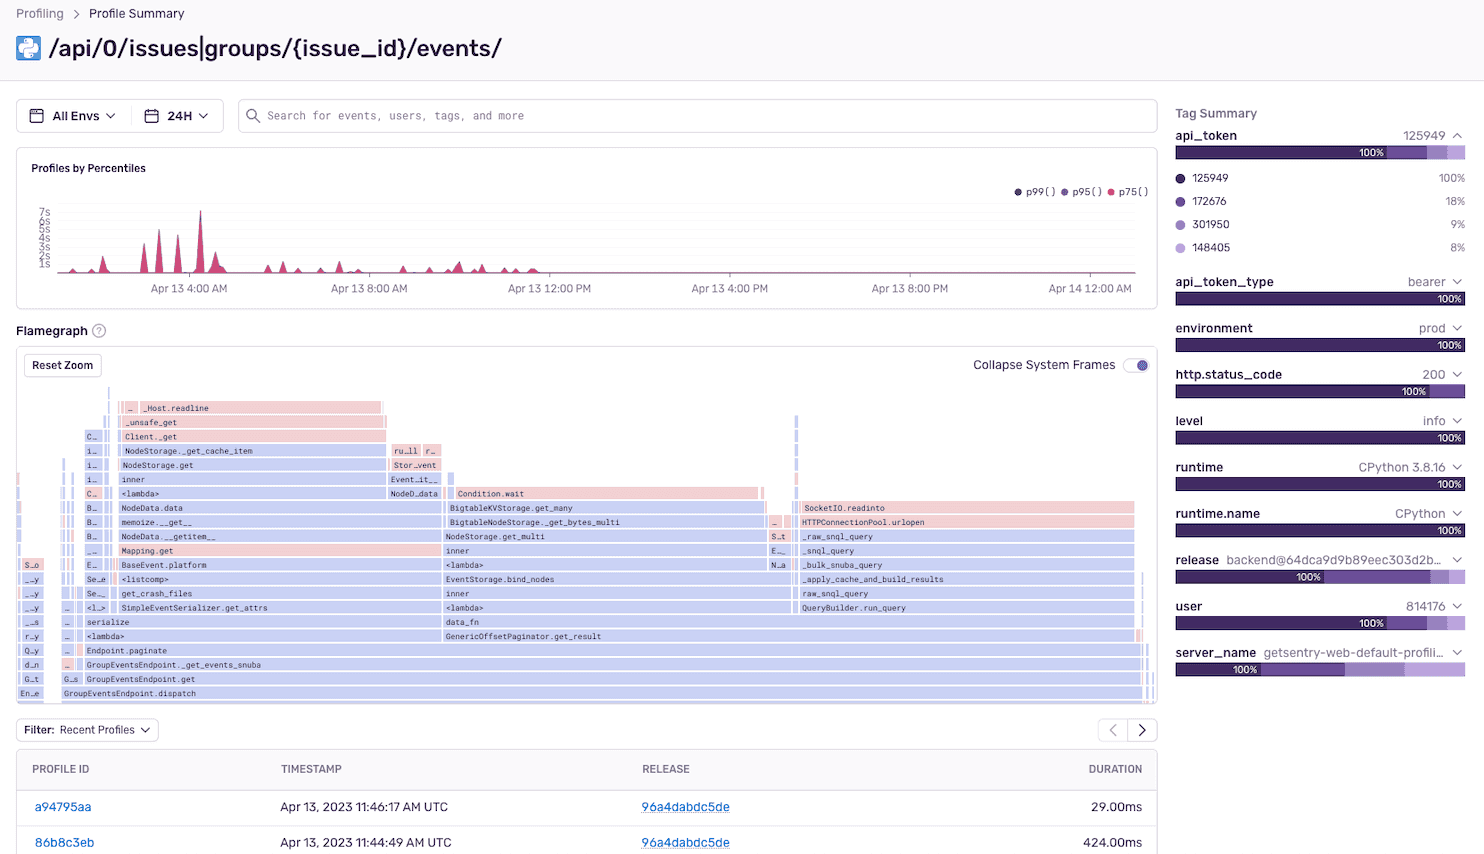
Selecting one of the transactions will take you to the Profile Summary page below. On this page, you can examine the aggregated flame graph that presents aggregated sample data for the selected transaction.
Learn More
To learn more about profiling tools, read the docs about Flame Graphs and Aggregated Flame Graphs.
Our documentation is open source and available on GitHub. Your contributions are welcome, whether fixing a typo (drat!) to suggesting an update ("yeah, this would be better").